When looking at 2014 as a whole it was a very surprising year. We finished 2013 with a flurry of activity and started 2014 with that activity. The year as a whole however ended up 6.2% down in total transactions. However, the average sales price was up 19.8%. The median sale price was up 11.1%. Even the average price per square foot was up 9.9%.
When looking at all of this data we get a clearer picture. Ultimately the high end market was extraordinary. The over $10M market which has been hit so hard lately was up 87% over last year. Obviously, this causes the median and average prices to jump. We had an incredible year, especially in the high end. When we hear that the average price per home is up, the median price is up, the amount per s.f. is up, it would be easy to say we had the year of all years. Conversely, if we said that the amount of transactions is down 6.2% we could say it was a slow year. As most times, the truth lies in the middle. In 2013 we saw the activity jump from 2012, but most of that was in the under $2M range and especially under $1m. This year, the inventory of these markets were lacking all year. In turn, that really affected the activity, and is where we saw most of the activity in 2013. The under $1M properties sold dropped 12% from 2013. The $1M-$2M dropped and even more astounding 21%. These price points have been the pulse of the market and is the reason that the activity dropped 6%.
In my opinion overall, the market in 2014 was good, and could have been great if we had more inventory, especially in the under $2M market. Everything points to a robust market in 2015. As mentioned, the activity for the year was down about 6%. However, when you look at November and December of this year we are up 7.5% on activity vs. 2013.
I have also included a link to the 4th Quarter Market Report my firm puts out for your review.
There are 493 properties for sale in Greenwich currently, 401 of which are single family homes. This is down quite a bit over the last few weeks. However, we are starting to see properties coming back on the market, so we should be seeing this number grow from here on out.
I want to mention an event that friends at the Junior League are helping to organize. There will be a panel to on preventing adolescent sports injuries. Maximizing Your Child's Athletic Potential: Expert Advice on Training Smarter and Preventing Injuries will be Thursday January 22nd at 7 p.m. at the Greenwich Library. Allan Houston will be the Moderator. Here is the flyer:
I have invested in my own MLS Search for my readers. This will give access to a lot of the listing information I have. Also, if I have already set you up with your personal portal, you will now be able to search your own searches outside of what I set up for you. Feel free to test out and search properties. I feel the best attribute is that you can save your own search and choose to get alerts as new properties come on to the market, properties are sold, or change in price. All specific to your customized search. Hence, you will speed up your learning curve, becoming an expert in the specific market you care about.
Please let me know if you would like me to provide customized information or statistics for you based on your criteria.
**The information on the featured property and all statistical information is from the Greenwich MLS.
**All opinions garnered from the statistics are my own
Properties Sold
When looking above you can see that April through July are what really hurt us this year. The beginning of the year and the last couple of months have held up very well. Unfortunately, April through July is the busiest part of the year.
New Listings
The new listings are pretty on par with last year with not much to analyze.
Year to Date Sold
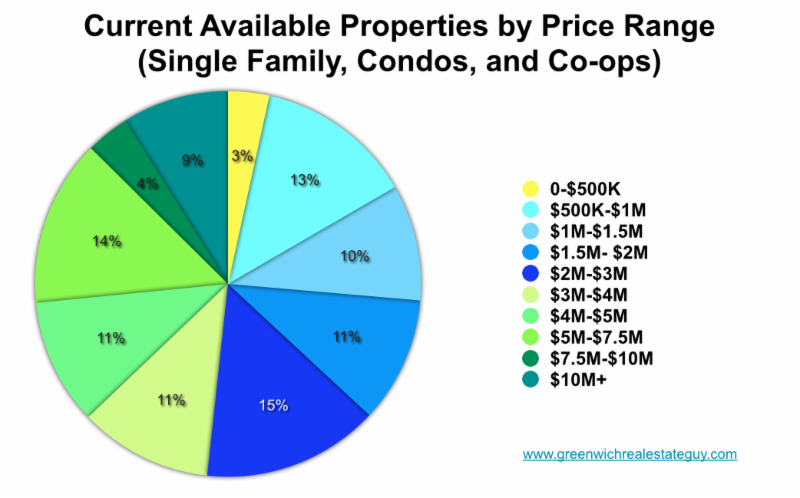
The value in these two charts are comparing the market of what is available vs. what has sold. For example the under $1M market accounted for 35% of the sold properties while only 16% of the current inventory. Hence, the sellers have the bargaining power. The $5M-$7.5M is 14% of the current available properties but only 4% of the sold. Hence, the buyers have the bargaining power.
Year to Date Available
In an effort to define the different markets as a good time to buy or sale I believe one needs to look at the months on average it would take to sell through the inventory we have. This one below is the amount of months on average to sell through our current inventory based on 2014 ytd sold numbers by price range.
Price Range
1/31/14
2/28/14
3/28/14
4/25/14
5/16/14
7/31/14
12/31/14
0-$500K
10.2
6.0
7.0
6.1
5.5
5.6
3
$500K-$1M
9.7
8.6
9.0
8.7
8.6
5.2
3.7
$1M-$1.5M
5.5
9.5
8.9
10.3
7.8
6.4
4.4
$1.5M-$2M
8
14.5
13.6
18.4
17.8
11
6.7
$2M-$3M
4.7
9.2
11.6
14.3
14.2
11.1
7
$3M-$4M
11
13.1
11.8
14.2
14.5
10.4
9
$4M-$5M
11.9
8.9
13.1
14.4
22.1
17.7
18.4
$5M-$7.5M
20.7
32.0
39.5
59
56.6
32
25.1
$7.5M-$10M
n/a
n/a
71.5
51
31.5
59.5
21.6
$10M+
22.4
27.2
42.0
22.7
33.8
29.9
35.2
As you can see the market needs more inventory in under $3M range and continue to see improvement in the higher price ranges. Obviously, in times of lower inventory it dramatically changes the numbers.
There are two individuals I feel most confident about when it comes to home mortgages. One in Manhattan and one in Greenwich. They are Jeff Ihrig of First Republic in Manhattan, and in Greenwich I prefer Treena David-Chirico of Wells Fargo NMLSR ID 404288.
Jeff can be reached at 646-372-5181. Treena's phone number is 203-618-3923. You can go to her website to input your specific information to receive rates. Her website is www.wfhm.com/treena-david-chirico.
 Jared Randall


Reader Comments